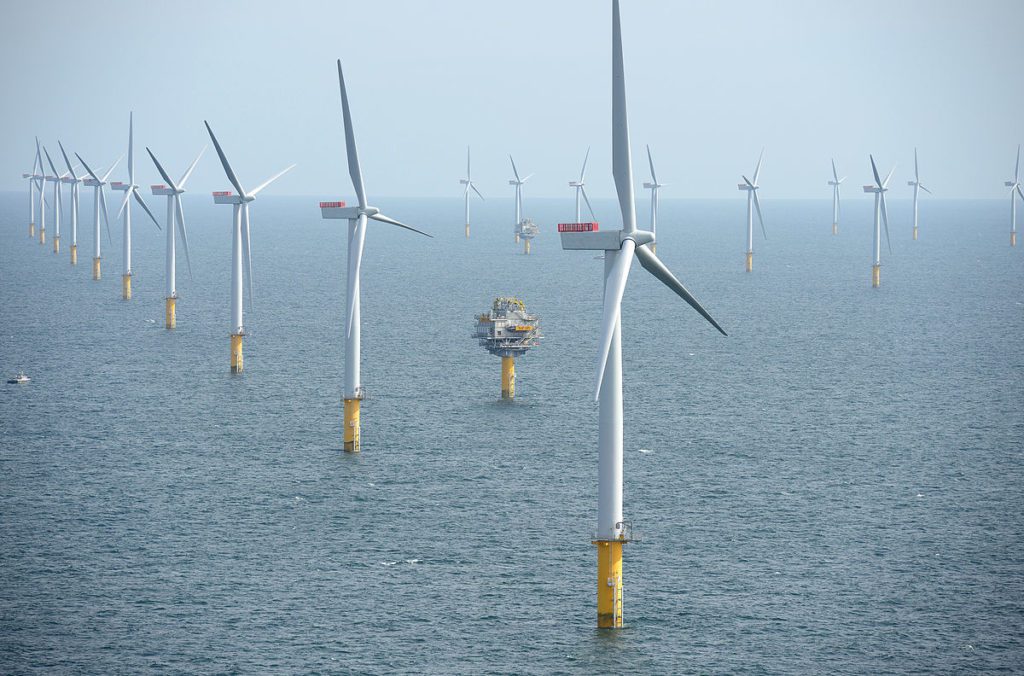
A string of billion-dollar deals off coasts of mainland China and Taiwan, and in British, French and Dutch waters, made 2019 an all-time high for offshore wind
London and New York, January 16, 2020 – Investment in renewable energy capacity worldwide was $282.2 billion last year, up 1% from 2018’s $280.2 billion, with the world’s biggest market (China) slipping back, but its second-largest (the U.S.) hitting a new record.
The latest data from research company BloombergNEF (BNEF), published today, show how what had been a subdued first few months of 2019 gave way to a busier second half, with the highlights including U.S. onshore wind and, in particular, offshore wind in China and Europe.
The late surge in offshore wind financings took capacity investment in that sector to $29.9 billion, up 19% on 2018 and $2 billion more than in the previous record year of 2016. Among the offshore projects reaching financial close in the fourth quarter were the 432MW Neart na Gaoithe array off the Scottish coast at $3.4 billion, the 376MW Formosa II Miaoli project off Taiwan at $2 billion and the 500MW Fuzhou Changle C installation in the East China Sea, at $1.5 billion. The first of France’s offshore wind projects to be financed, the 480MW, $2.5 billion Saint Nazaire, got its go-ahead in the third quarter.[1]
Tom Harries, head of wind research at BNEF, commented: “Offshore wind developers in China brought forward 15 projects to beat a scheduled expiry of that country’s feed-in tariff. We expect the sector’s global momentum to continue in 2020, with the focus on gigawatt-scale projects in the British North Sea and the first commercial arrays off the U.S. East Coast.”
Looking at the overall renewable energy capacity investment figures for 2019, wind (onshore and offshore) led the way with $138.2 billion globally, up 6%. Solar was close behind, at $131.1 billion, down 3%. Falling capital costs in wind and solar meant that the two combined are likely to have seen around 180 gigawatts added last year, up some 20GW on 2018.
Among the smaller sectors, biomass and waste-to-energy saw $9.7 billion of capacity investment in 2019, up 9%. Geothermal languished on $1 billion, down 56%. Biofuels were down 43% at an estimated $500 million, and small hydro 3% lower at $1.7 billion.[2]
China was yet again the biggest investor in renewables, at $83.4 billion in 2019, but this was 8% down on 2018 and the lowest since 2013. It saw a 10% rise in wind investment to $55 billion, but solar fell 33% to $25.7 billion, less than a third of the boom figure reached in 2017. The U.S. was the second-largest investing country in renewable energy capacity, at $55.5 billion, up 28% on 2018. Instrumental in this was a rush by wind and solar developers to qualify for federal tax credits that were due for scale-back in 2020.
“It’s notable that in this third year of the Trump presidency, which has not been particularly supportive of renewables, U.S. clean energy investment set a new record by a country mile,” said Ethan Zindler, head of Americas for BNEF, noting that the second-highest year for investment ($45.7 billion) came in Trump’s first year, 2017. “These technologies are more cost-competitive than ever, and the fact that there was a tax credit step-down on the horizon made the market particularly busy in 2019.”
Europe slipped behind the U.S. in 2019, investing $54.3 billion in renewables capacity, down 7%. Spain led the way with $8.4 billion, up 25% on 2018 and the highest annual figure for that country since 2011.
Pietro Radoia, senior associate for solar at BNEF, said: “The $6 billion of solar investment in Spain in 2019 is impressive because these projects are going ahead at record-low costs per megawatt. Developers are building PV parks on the back of low tariffs agreed in government-run auctions or, increasingly, without any subsidy support at all.”
The U.K. invested $5.3 billion, down 40% and its lowest since 2007. Germany was down 30% at $4.4 billion, its lowest since 2004, and Sweden was down 19% at $3.7 billion, but the Netherlands were up 25% at $5.5 billion, France 3% higher at $4.4 billion, and Ukraine 56% up at $3.4 billion.
Japan invested $16.5 billion in renewable capacity, mainly solar, in 2019, down 10%, while Australia committed $5.6 billion, down 40%. India put $9.3 billion into green energy, 14% less than in 2018, while the United Arab Emirates invested a record $4.5 billion – almost all of it for the 950MW Al Maktoum IV solar thermal and photovoltaic complex in Dubai.
In Latin America, Brazil lifted renewable energy capacity investment by 74% to $6.5 billion last year, while Mexico committed $4.3 billion, up 17%, and Chile $4.9 billion, up fourfold, and Argentina $2 billion, down 18%.
BNEF’s wider-definition of total clean energy investment, which includes money going into research and development, and into specialist companies via public market share issues and venture capital and private equity deals, was $363.3 billion in 2019, fractionally up on the previous year’s revised $362.5 billion.[3]
Within this total, public markets invested $9.3 billion in clean energy, 13% less than in 2018, while VC/PE investors put in $10.5 billion, up 6% and their highest figure since 2010. U.S. electric car companies accounted for the biggest deals in both categories: Tesla with an $862.5 million public market secondary issue, and Rivian Automotive with a $1.3 billion private equity round.
Corporate and government research and development in wider-definition clean energy totaled $45.7 billion in 2019, up 1%.
More on BNEF’s 2019 clean energy investment figures can be found at https://about.bnef.com/clean-
Figure 1: Global renewable energy capacity investment, 2004 to 2019
Source: BloombergNEF. Note: the figures represent utility-scale asset finance of new wind, solar, biomass and waste-to-energy, geothermal, small hydro and marine power projects, plus small-scale solar systems. Prior years’ totals have been revised in this round, to reflect new information. Totals are rounded to nearest billion dollars.
