A new study on behalf of Milliken has identified the top U.S. states for sustainable energy production.
The rapid rise of the sustainable energy sector worldwide has been one of the most important technological and economic stories of recent years.
Continued urgency to mitigate the impact of climate change has spurred governments and companies to speed the transition to greener energy sources. Global geopolitical conflicts involving major fossil fuel producers have motivated more countries to strengthen their energy security with sustainable sources. Technological advances in wind, solar, and battery storage have improved the economics of sustainable energy, allowing these sources to compete with—or even outpace—other energy sources.
These trends have all played out in the U.S. and contributed to the rising importance of sustainable energy sources like wind, solar, nuclear, hydroelectric, and geothermal. Recent legislative milestones, including the Bipartisan Infrastructure Law and the Inflation Reduction Act, reflect federal efforts to further expedite the transition towards cleaner energy sources. Businesses operating in these sectors already constitute a burgeoning segment of the U.S. economy and are poised to sustain this trajectory in the years ahead.
Trends in Sustainable Energy Production
Recent sustainable energy growth has been driven by gains in wind and solar

Source: Milliken analysis of U.S. Energy Information Administration data | Image Credit: Milliken
Sustainable energy production has long been a component of the U.S. energy landscape, but recent technological and economic shifts have contributed to growth in the sector. In the early 2000s, sustainable sources accounted for approximately a quarter of the nation’s electric energy production—primarily derived from nuclear and hydroelectric sources—collectively yielding roughly 1,000 terawatt-hours of electricity annually. However, both nuclear and hydroelectric energy have faced stagnation in the United States due to concerns surrounding capital costs, construction timelines, and environmental implications, leading to limited new development as aging facilities are decommissioned.
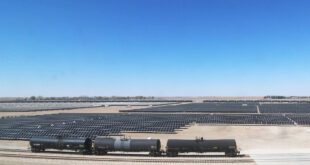
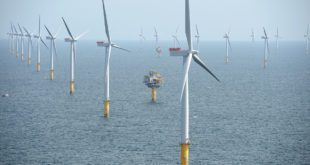
Instead, much of the growth in the sustainable energy sector in recent years has come from wind and solar power. Substantial government subsidies allocated to these sustainable forms of energy have played a pivotal role in reducing costs and enhancing technological efficiency. Consequently, wind and solar energy production have experienced rapid expansion. From 2001 to 2023, annual solar energy output escalated from half a terawatt-hour of electricity to an impressive 238 terawatt-hours, while wind power surged from 6.7 terawatt-hours to over 425 terawatt-hours during the same period. The growth in these two sectors has increased the share of U.S. energy production from sustainable sources to nearly 40%.
Geographical Differences in Sustainable Energy Businesses and Output
California, Texas, New York, and Illinois lead the country in sustainable energy production businesses

Source: Milliken analysis of U.S. Census and U.S. Energy Information Administration data | Image Credit: Milliken
A select few states within the U.S. have emerged as frontrunners in leveraging the expansion of sustainable energy enterprises. Notably, California and Texas lead in both the total number of sustainable energy businesses and overall sustainable energy production. California, the nation’s leading state for sustainable energy production businesses with 215, has pioneered growth in solar energy through substantial government incentives and a robust technology sector. Meanwhile, Texas stands out as the nation’s top sustainable energy producer, annually generating 193 terawatt-hours, leveraging its geographically advantageous landscape conducive to both wind and solar energy production. Other states with encouraging government policy or favorable geographic attributes, such as New York and Illinois, also have strong sustainable energy sectors.
Areas Where Sustainable Energy Has the Largest Market Share
Sustainable energy businesses have the largest market share in the Northwest and New England

Source: Milliken analysis of U.S. Census and U.S. Energy Information Administration data | Image Credit: Milliken
States differ, however, in the share of their energy economies attributable to sustainable sources. For instance, despite Texas’s high number of sustainable energy firms and substantial sustainable energy generation, the Lone Star State only receives about one-third of its overall energy output from sustainable sources, and less than half of its energy production firms are primarily focused on sustainable sources. Conversely, Western states like Washington and Idaho, which have well-established hydroelectric power industries, and New England states like Vermont and New Hampshire, which tend to be more environmentally progressive, all tend to receive a greater share of energy from sustainable sources and have more energy businesses focused on sustainable production.
States With the Most Businesses Focused on Sustainable Energy
| State | Rank | Share of energy production businesses in sustainable energy | Share of energy production employment in sustainable energy | Share of energy production payroll in sustainable energy | Share of energy production from sustainable sources | Change in energy production from sustainable sources (2018–2023) | Largest sustainable energy source |
|---|---|---|---|---|---|---|---|
| Oregon | 1 | 79.0% | 65.9% | 71.6% | 60.7% | -7.5 pp | Hydroelectric |
| Montana | 2 | 78.3% | 30.7% | 43.4% | 48.5% | +0.3 pp | Hydroelectric |
| Idaho | 3 | 75.4% | 71.7% | 71.5% | 65.1% | -13.7 pp | Hydroelectric |
| Washington | 4 | 72.7% | 19.7% | 20.0% | 76.8% | -7.6 pp | Hydroelectric |
| Maine | 5 | 67.9% | 28.7% | 33.1% | 55.9% | +5.5 pp | Hydroelectric |
| California | 6 | 65.8% | 67.1% | 64.8% | 59.0% | +6.1 pp | Utility-scale solar |
| Iowa | 7 | 65.8% | 51.2% | 45.7% | 61.6% | +18.6 pp | Wind |
| Florida | 8 | 62.9% | 25.2% | 23.7% | 18.2% | +5.0 pp | Nuclear |
| South Carolina | 9 | 61.4% | 71.1% | 74.6% | 60.0% | +3.3 pp | Nuclear |
| New York | 10 | 61.3% | 72.1% | 73.8% | 51.7% | -6.8 pp | Hydroelectric |
| Nevada | 11 | 60.0% | 53.9% | 40.5% | 39.3% | +12.2 pp | Utility-scale solar |
| Wisconsin | 12 | 59.6% | 33.3% | 33.1% | 22.4% | +0.8 pp | Nuclear |
| Virginia | 13 | 57.0% | 63.8% | 65.6% | 40.3% | +7.0 pp | Nuclear |
| New Hampshire | 14 | 56.5% | 22.9% | 18.4% | 68.7% | -0.7 pp | Nuclear |
| North Dakota | 15 | 54.8% | 6.6% | 4.8% | 39.6% | +7.0 pp | Wind |
| United States | – | 47.6% | 41.8% | 42.0% | 39.9% | +4.7 pp | Wind |
Methodology
The data used in this analysis is from the U.S. Census Bureau’s 2021 County Business Patterns and the U.S. Energy Information Administration’s 2023 Electricity dataset. To find the states with the most businesses focused on sustainable energy, researchers at Milliken calculated the sustainable energy production businesses as a percentage of all energy production businesses. Sustainable energy production was considered to be electricity generation that does not directly emit carbon dioxide, including: nuclear, conventional hydroelectric, wind, solar, and geothermal energy. The researchers also calculated the share of energy production employment in sustainable energy, the share of energy production payroll in sustainable energy, the share of energy production from sustainable sources, the change in energy production from sustainable sources from 2018 to 2023, and the largest sustainable energy source in each state.
 Alternative Energy HQ solar power for homes, wind energy, and bio fuel issues


